What has 2020 done to the UK’s alcohol consumption?
Alcohol stats expert Colin Angus trawls through a lot of data to work out Brits’ drinking habits in this exceptional year
|
02 December 2020 – To say 2020 has been tumultuous would be something of an understatement. It’s been a strange old year full of crisis and, well, more crisis. If stereotypes are to be believed, then the pub or the drinks cabinet is one of the first ports of call for the British when hard times strike. So it might seem reasonable to suspect that we’ve all been drinking more this year. Yet at the same time, pubs have been closed, or severely restricted, since late March, and we drink a lot in pubs. So maybe we’re drinking less overall?
Mixed messages
We’ve certainly been given conflicting messages about alcohol sales over the course of the year. Back in March when lockdown was announced there were media reports about panic buying and images of bare shelves in supermarkets. There were also a series of stories driven by market research company data which reported that alcohol sales had risen, maybe by as much as 58%. However these stories all focused exclusively on shop-bought alcohol. In 2019, 28% of alcohol sold in Great Britain was bought and drunk in pubs, clubs, cafés and restaurants. If the pubs were closed, we could all buy 40% more alcohol from the supermarket and barely end up drinking more than before.
Alongside these stories, we’ve seen a large number of surveys during and after lockdown which have asked respondents whether they think they’ve been drinking more or less than before the pandemic. You might be suspicious, and with good reason, about the accuracy of measures like this, but the picture they painted, almost unanimously, was one of mixed effects. Some people reported that they had been drinking less or had even given up alcohol entirely, while others reported that they were drinking more than usual. Often there was some degree of polarisation, with people who were drinking within the UK drinking guidelines of 14 units of alcohol a week before lockdown began being much more likely to say they were drinking the same or less, while heavier drinkers were more likely to have increased their drinking. This polarisation was reinforced by a more robust study which found that, in April, the number of people who reported attempting to cut down their drinking increased significantly, while at the same time, so did the number of people reporting that they were drinking at high-risk levels. Taken together, it was hard to make sense of this data. As somebody who has spent more time than most looking at alcohol consumption patterns and data over the last decade, my suspicion was that we were probably drinking less on average, but that some people, particularly heavier drinkers, were drinking more.
 |
Show me the numbers
With this suspicion in mind, I was surprised to see the Office for Budget Responsibility state in their latest economic forecast, published last week, that “The loss in [alcohol duty] receipts from closures of pubs and restaurants has been more than offset by higher sales in supermarkets and other shops”. Luckily, HMRC published their quarterly alcohol duty bulletin a few days later, so I didn’t have to wait long to see where this claim came from.
Sure enough, HMRC state that they collected £313m more in alcohol duty in April-October 2020 than in the same period in 2019, an increase of 4.5%. So, does this mean that alcohol sales have gone up by 4.5%? Well, no. This figure doesn’t account for inflation. If we look at the longer-term trend in alcohol duty receipts, we can see that in cash terms (i.e. before adjusting for inflation) they have been rising steadily for years, while in real terms (i.e. after adjusting for inflation) they have been pretty stable for at least a decade.
Well, by this measure, alcohol duty revenue in 2020 has actually fallen slightly, by just under 1%. But there are some interesting patterns in this. Duty receipts fell very sharply in March and April and then we see much more revenue collected than usual in June and August. It’s tempting to interpret this as showing that we were all very abstemious during lockdown and then had a bit of a party once restrictions were lifted, but that’s not quite right. These numbers reflect the actual payments received by HMRC from the alcohol industry. Usually these are collected within a month of the alcohol being cleared for sale, but in exceptional circumstances it is possible to negotiate a payment extension of up to three months. HMRC themselves highlight this as the likely cause for these unusual spikes – they really relate to alcohol sold a few months previously, but where payment was deferred due to the financial pressures that lockdown imposed on many alcohol producers. This suggests that the dip in March and April was maybe not as big as it seems in reality.
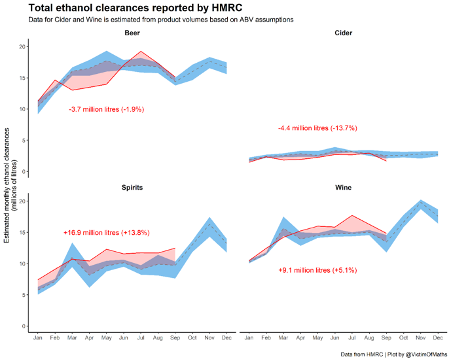
Luckily, HMRC also provide data on how much alcohol has been cleared for sale. As beer and spirits are taxed based on their alcohol content, we have great data on the volume of alcohol being sold as these two products. Wine and cider, however, are taxed on the basis of their product volume, so we have to make a few assumptions about their alcoholic strength. When we do this, a clearer picture emerges. The amount of alcohol cleared for sale did dip in March, but only very slightly, and this has been more than offset by higher than usual clearances in July – September. Now these figures reflect the amount of alcohol released for sale, not the amount sold, nor the amount actually drunk. It could be that all of this extra alcohol is just stacked up on supermarket shelves, or in our drinks cabinets, but that seems fairly unlikely to me. It is probably true that some pubs did have to throw away some products, particularly beer, which had spoilt during the spring lockdown. In fact, they are entitled to claim back the duty they have paid on this spoilt alcohol. This means that it's likely that the increase in alcohol sales in 2020, compared with previous years, is slightly less than 3.4%, but it's unlikely to be much less.
Have different products been affected differently?
As HMRC report their data separately for beer, cider, spirits and wine, we can actually look at how these different types of alcohol have been affected differently. Looking at revenue, you can see a huge fall in revenue from beer sales during the spring lockdown. In relative terms cider has actually seen an even bigger fall, although it makes up a much smaller proportion of the market. At the same time, duty revenue from wine has picked back up after a dip in the spring, while spirits revenue has increased by almost 9% over the year.
| |
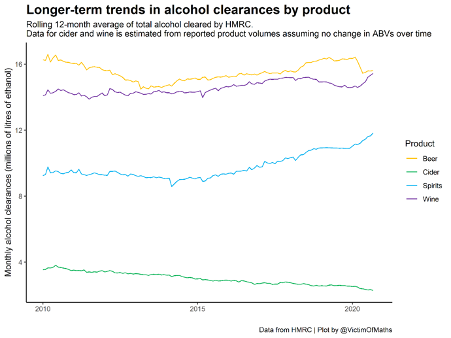
In fact some of these product-level changes could well just be continuations of pre-existing trends. Monthly clearances of cider have been falling for years and spirits have been rising, driven to some extent by the ‘gin boom’, since 2015. It certainly does look as though there might have been some switching between beer and wine. Or perhaps beer drinkers are the ones who are taking the opportunity to try and drink a little less, while wine drinkers are drinking more.
Tl;dr
After all of these graphs, what do we really know about drinking in 2020? Alcohol consumption probably did fall overall at the start of lockdown in the spring, but we seem to have more than made up for it in the latter part of the summer and overall alcohol sales have increased in 2020 compared with previous years. Due to the various restrictions and enforced closures that have affected pubs across the UK this year, it seems very likely that 2020 has been a bonanza year for alcohol sales in supermarkets. We have also seen some quite large shifts away from beer and towards wine and particularly spirits. It will be interesting to see whether these are sustained once things (hopefully) start returning to normal in 2021. Finally, it’s important to remember that HMRC data reflects the total revenue and alcohol clearances across the whole population. Whether the small increase in overall alcohol sales reflects a small increase across the whole population, or a large increase in a small number of heavy drinkers, will have a large bearing on what the longer term alcohol-related health impacts of these changes are, and that’s something that we won’t start to find out for some time yet.
Written by Colin Angus, research fellow at the Sheffield Alcohol Research Group within The School of Health and Related Research.
All IAS Blogposts are published with the permission of the author. The views expressed are solely the author's own and do not necessarily represent the views of the Institute of Alcohol Studies.
The piece was originally published by The Institute of Alcohol Studies and republished by theirs and Colin Angus' kind permission.


