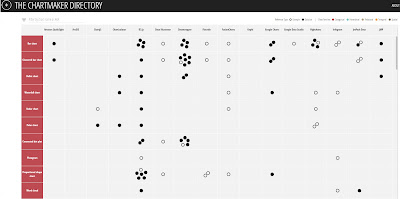
For those moments when you have seen a type of chart somewhere and want to recreate it, but aren't exactly sure how. The Chartmaker directory website is a simple matrix with software packages/websites along the top, and different chart types down the side. Each cell is populated with links to reproducible examples, code or how-to guides to make that chart type in that software package.
 |
| http://chartmaker.visualisingdata.com/ |
So if you want to know how to coax Excel into drawing a heatmap, draw a Sankey diagram in Google Sheets, show maps in Stata (who knew you could do that?), or draw a lollipop chart in R, then this website will show you a link to do just that. It also gives you an idea of when the software you want to use just can't be bullied into making the graph you want, which is always useful to know.
